ELEMENTARY SCHOOLS AND RESIDENTIAL ABSORPTION RATES IN NEW NEIGHBOURHOODS
INTRODUCTION
Elementary schools have long been an important component in the planning of new suburban neighbourhoods. Nieghbourhood scale and boundaries are often related to the location and catchment of elementary schools. Schools are usually planned in combination with the neighbourhood park and the pedestrian system to provide for an inward neighbourhood focus and identity. Elementary schools, in addition to providing for the education of children, also often function as the cultural, social, and recreational focus of the neighbourhood.
Marketing material for new neighbourhoods often use new schools as part of the marketing message. Anecdotal evidence from developers, builders and sales people suggest that homes in neighbourhoods planned and developed with schools are more attractive to more buyers, especially families.
This paper examines the absorption rates of three suburban residential areas (located in the City of Waterloo), each having a different elementary school context (See Figure 1).
Figure 1. Locational context of three residential areas in the City of Waterloo
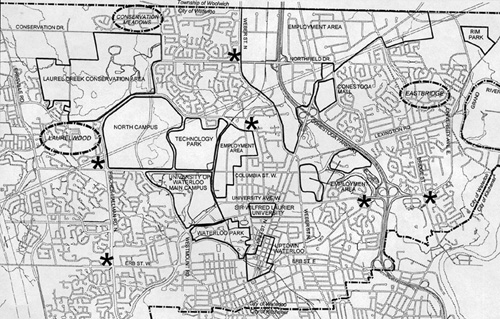
The first (Laurelwood) experienced the early construction of a public school and later a separate school. In the second (Eastbridge), separate and public schools were constructed later in the development of the neighbourhood. The third (Conservation Meadows) residential area had a "contingency" school site, which was eventually deemed to be not required, and students in part had to be bussed to schools in other neighbourhoods.
COMPARING THE DEVELOPMENTS
Three neighbourhoods were chosen having as many similar attributes as possible;
•
All are located in the City of Waterloo.
•
All were registered within a similar time period (1995 to 1998).
•
All were developed and built-out during the same general economic conditions in the regional housing market.
•
All were part of comprehensively planned suburban neighbourhoods. All contained elements of protection of environmental features, park planning, and pedestrian connections.
•
All had a similar design approach to the street layout (minor collectors, crescent streets and cul de sacs). None could be characterized as "new urbanism".
•
All are well separated from incompatible land uses and have general access to the arterial road network.
•
Each was of a comparable scale of development (534 units, 559 units, and 608 units) with the smallest equal to 88% of the largest.
•
Each had a comparable mix of low rise, freehold housing;
Table 1.
.
DETACHED
DETACHED
TOWNHOUSES
TOTAL
MEADOWS
359 (67%)
92 (17%)
83 (16%)
534
• Each had a degree of additional design amenity in the form of entrance gates and/or landscaped boulevards.
THE THREE DEVELOPMENTS AND SCHOOL CONTEXT
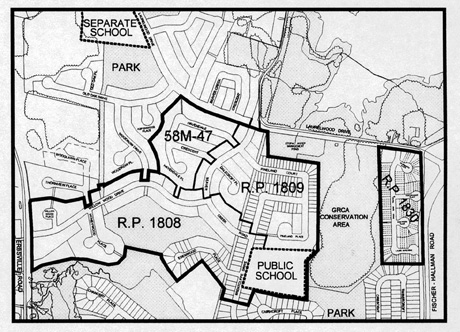
The Laurelwood study area (see Figure 2) in northwest Waterloo consists of 559 residential units. The development is characterized by the early site acquisition (1995) and construction (1997) and opening (1998) of a public elementary school, followed by the construction (2000) and opening (2001) of a separate elementary school. The following graph (see Figure 5) illustrates strong building permit activity, peaking in years 3 and 4 (coincident with the construction and opening of the public school), with build out occurring within 6 years.
Figure 2. Laurelwood Development
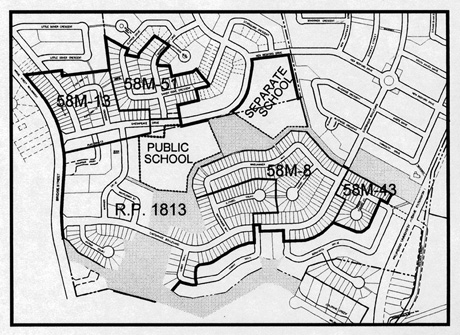
The Eastbridge study area (see Figure 3) in northeast Waterloo consists of 608 residential units. Construction of the public school started in fall 2000 and the school opened in 2002 (4 years after the public school in Laurelwood). Construction of the separate school started in 2001 and the school opened in 2002 (1 year later than Laurelwood). The following graph (see Figure 5) illustrates substantial build-out within 7 years with peak building permit activity in year 3 with a secondary plateau in years 4 and 5.
Figure 3. Eastbridge Development
The Conservation Meadows study area (see Figure 4) in north Waterloo consists of 534 residential units. Initially, a public school site was included in the plan on a contingency basis (and never purchased). In May of 1997, the School Board advised this site would no longer be needed. Students from this neighbourhood attend schools in other districts. A separate school was neither planned nor constructed within Conservation Meadows.
Figure 4. Conservation Meadows Development
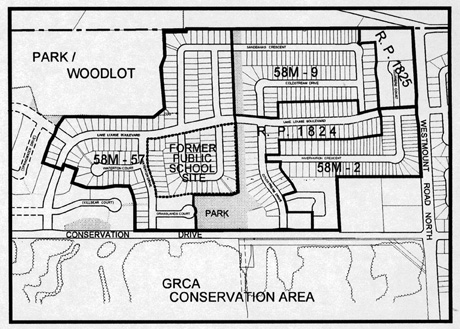
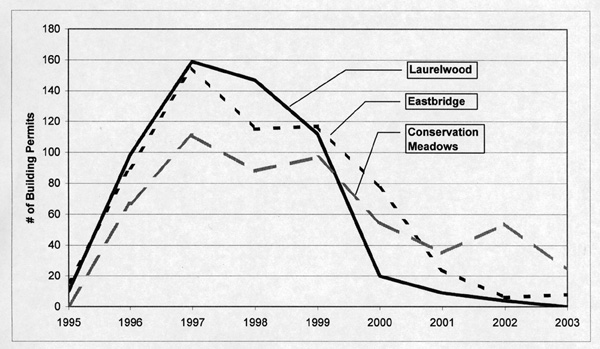
The following graph (see Figure 5) illustrates substantial build-out within 8 years (2 more than Laurelwood and 1 more than Eastbridge). In addition, the peak building permit year, while also occurring in the third year is less prominent than in the other two developments (the third year peak of building permits issued, constitute 28% of the Laurelwood development, 25.5% of Eastbridge, and 21% of the Conservation Meadows development).
Figure 5. Number of Building Permits Issued by Neighbourhood
SUMMARY OF ABSORPTION RATE COMPARISON
Figure 6 compares the build-out of the three areas as a cumulative percentage of total units.
Figure 6. Comparison of Absorption Rates
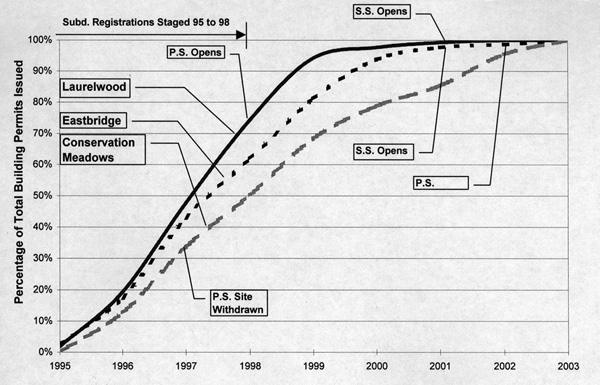
Initially, the variance in build-out is low, as all three areas commence. The variance gradually increases to 0.5 years at 50% build-out, increasing to 1.0 years at 75% and 2.0 plus years at 95%.
When Laurelwood's issued building permits achieve 94% in 1999 (year 5), Eastbridge achieves 81% and Conservation Meadows achieves 75%.
Table 2. Number of Years to Build-out (adjusted to timing of registration)
.
MEADOWS
2.0 YRS.
3.4 YRS.
5.0 YRS.
7.3 YRS.
ANECDOTAL EVIDENCE
Interviews were conducted with developers and salespeople. It was felt that the early public school opening in Laurelwood helped absorption. It was also positive that the public school opened first given the greater percentage of people using public schools. The fact that the public school was a new school central to the development was also helpful. The developer also worked with the City and the School Board to obtain community access to the school. This was a good fit with their marketing of the community. One of the Laurelwood advertising campaigns was based on the theme "I live here, I play here, I teach here".
Discussions with one of the salespeople for Conservation Meadows indicate that the withdrawal of the contingency school site, and bussing of students for the west portion of the development produced a noticeable shift in builders' interests. Some decided to buy in Laurelwood because of the new public school. Some turnover of builders was experienced even though lot prices per foot were higher in Laurelwood.
IMPACT ON STUDENT COMPOSITION
The following table summarizes the number of students for public and separate junior kindergarten to grade 8 in the three neighbourhoods. The public students in Laurelwood equal the combined number of public school students in both Eastbridge and Conservation Meadows. This is indicative of the early opening of the Laurelwood Public School. The Eastbridge and Conservation Meadows students are relatively close in number suggesting that the late opening of the public school in the Eastbridge Community had an effect on the attraction of families in the early part of the Eastbridge development.
Table 3. Elementary Student Distribution by Neighbourhood
.
OF UNITS
PER
AREA
AREA
UNIT
AREA
UNIT
AREA
UNIT
MEADOWS
534
186
0.35
104
0.19
290
0.54
SUMMARY OF FINDINGS
In summary;
•
The early opening of a new elementary school can attract a high proportion of families as reflected in high student numbers per residence.
•
Developers can leverage this opportunity, along with other amenities, in the successful marketing of a community.
•
It is difficult to account for the many variables, which can influence the speed of development. However, the anecdotal evidence and the rates of development in this case study indicate that new school construction has a positive effect on absorption rates.
-Bernard P Hermsen, BES, MCIP, RPP
-Pierre J. Chauvin, BSc, MA, MCIP, RPP
Bernie Hermsen is a Principal with MacNaughton Hermsen Britton Clarkson Planning Limited in Kitchener.
Pierre Chauvin is a Senior Planner with the firm.
This article is published in the OEA Newsletter, Spring 2004.